IMHO the best teachers give their pupils a physical exercise to achieve the correct psychological mindset (what to concentrate on) for achieving a task. A good example of this is a driving instructor getting their pupils to look in the rear view mirror every two seconds. This exercise makes the pupil observant and while doing so they naturally adjust their speed and distance to match the circumstance. The magic is that the exercise is easier for them to execute than commanding their brain to "be observant".
This is informed observation because they are observing/concentrating on the correct things (front and back), if they were only looking at the Ferrari in front of them, they will more than likely have an accident shortly.
I am not aware of a correct physical exercise (informed observation) for trading. But I do know that the correct mindset (from all that I've read and been taught) is quality over quantity / going for high probability trades, not lots of them. From all that I can understand the highest probability trades are trend trades that occur in some kind of pullback (oversold in an uptrend) or rally (overbought in a downtrend). An argument could also be made for counter trend trades that are overextended from the mean but for now I'm going to keep it simple and just look for trend trades.
I would assume that staying up to date with the trend and it's changes would be the correct physical exercise to help one to trend trade successfully. Focusing on PB and RL are probably most important as these give direction and offer the highest probability trades.
METHOD
An uptrend = a series of Higher Lows ( I should label these and draw a best fit UWTL touching as much as possible. Going for the most obvious TL!)
 A Downtrend = a series of Lower Highs (I should label each of them and draw a best fit DWTL touching as much as possible,Going for the most obvious TL)
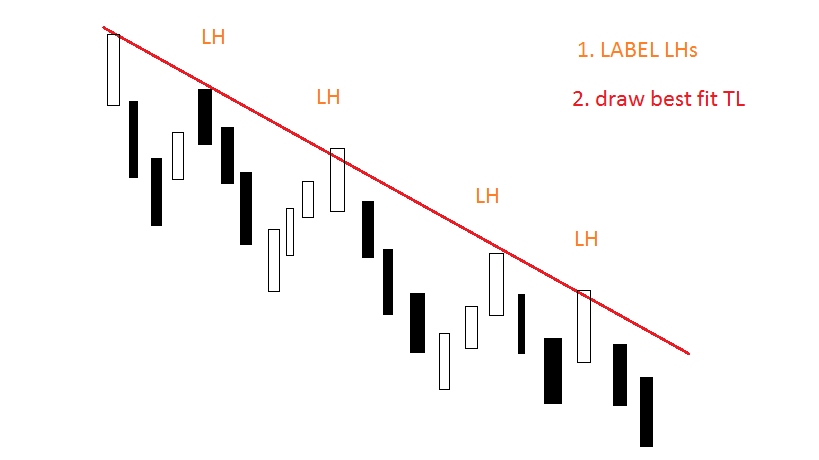
To trade the trend I want to buy when price is Oversold in an uptrend, or Sell when price is overbought in a downtrend. These are the highest probability trades. The best trades are TL and EMA PB/RL or if price can't reach them entering on a 2nd,3rd,4th entry after a new trend extreme.
TL PB Trade
 EMA PB Trade
 2nd/3rd/4th Entry from Trend Extreme Trade

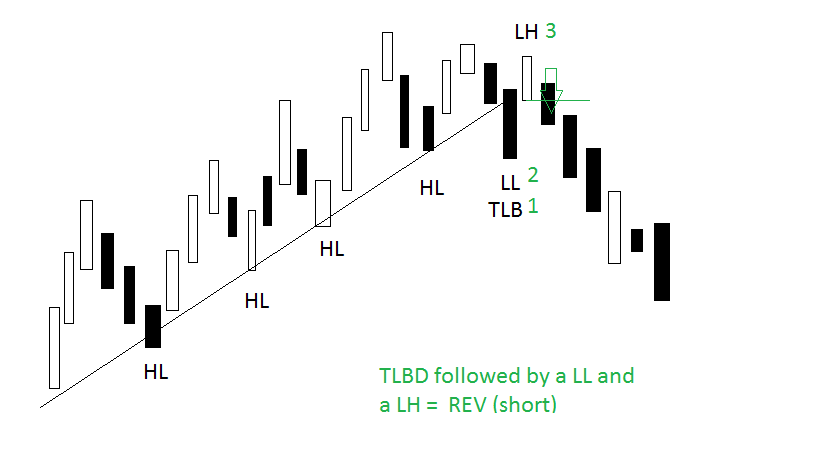
Once a TL is in place you don't need to worry too much about marking HLs/LHs until it breaks as this suggests a possible trend reversal. On a TL break you need to label the last couple of HLs/LHs and continue to do so after the break to see if you have a reversal.
On a TL Break have no bias , be prepared for a trade in either direction, a reversal or a test of the trend extreme.
Uptrend Reversal Trade
Downtrend Reversal Trade

Initial Stop Loss and Trailing Stop Loss Methods
Long SLs
 Short SLs

This is informed observation because they are observing/concentrating on the correct things (front and back), if they were only looking at the Ferrari in front of them, they will more than likely have an accident shortly.
I am not aware of a correct physical exercise (informed observation) for trading. But I do know that the correct mindset (from all that I've read and been taught) is quality over quantity / going for high probability trades, not lots of them. From all that I can understand the highest probability trades are trend trades that occur in some kind of pullback (oversold in an uptrend) or rally (overbought in a downtrend). An argument could also be made for counter trend trades that are overextended from the mean but for now I'm going to keep it simple and just look for trend trades.
I would assume that staying up to date with the trend and it's changes would be the correct physical exercise to help one to trend trade successfully. Focusing on PB and RL are probably most important as these give direction and offer the highest probability trades.
METHOD
An uptrend = a series of Higher Lows ( I should label these and draw a best fit UWTL touching as much as possible. Going for the most obvious TL!)
To trade the trend I want to buy when price is Oversold in an uptrend, or Sell when price is overbought in a downtrend. These are the highest probability trades. The best trades are TL and EMA PB/RL or if price can't reach them entering on a 2nd,3rd,4th entry after a new trend extreme.
TL PB Trade
Once a TL is in place you don't need to worry too much about marking HLs/LHs until it breaks as this suggests a possible trend reversal. On a TL break you need to label the last couple of HLs/LHs and continue to do so after the break to see if you have a reversal.
On a TL Break have no bias , be prepared for a trade in either direction, a reversal or a test of the trend extreme.
Uptrend Reversal Trade
Downtrend Reversal Trade
Initial Stop Loss and Trailing Stop Loss Methods
Long SLs
Higher highs, lower lows... reminds me of my first time skiing, I was taught to use the "wedge" technique where I would point my skis inward for better control. My first time down the bunny slope I could have killed someone if they would have gotten in my way; I had zero control.
ReplyDeleteI say all that to say that I agree with higher highs and lower lows, that that these are characteristics of a trend, but the entry that makes the real money is getting in before 90% of the market sees that the market is trending. Honestly it is hit or miss, some months the market will trend well, but in the past few years, it seems the clean trends of higher highs or lower lows is becoming less common.
Not sure where I am going with this comment, so i will end it with just for you to trade within your plan and method. The only thing that can be consistent about the market are the trades you are willing to take.
Hi Trin thanks for the comment and insights,like the skiing metaphor :-)
DeleteJmf3/scalping the stretch put me on to Al Brooks a month ago and I've been work through his book. This idea is basically a basic version of his trend trading method.
I completely get what your saying about getting in before the trend starts, I frustratingly missed a couple of those move last week and its a very valid point your making and something that I was concerned about. I am glad you made a point of it too. Sometimes I think I'm being paranoid ;-)
Do you mind me asking how you try to exploit these moves?
Thank you for the encouragement and advice re the plan, I shall endeavour to be disciplined!
Have a great week.:-)
George, as for how I try to exploit the moves, I use basic technical analysis and the Ninja Trader DM indicator. I'm looking to take trades that have a lot of momentum behind it, some days trading seems very easy, other days I am humbled very quickly. By waiting for a particular trade setup, I can get consistent profitable results; but this also limits the number of trading opportunities... not conducive to trading for a living.
ReplyDeleteI also trade options, I plan on making this a big part of my overall trading strategy... waiting for the markets to trend is the toughest part of trading for me. By trading options, I can profit in a up, down or a sideways market. Options can be tricky, so I try not to over do it. Sorry for the long explanation, I did not want to mislead you into why or how I take so few day trades.
We are only as disciplined as our last trade, in this business one bad trade is all it takes to ruin years of progress.
Trin thank you for going into this for deeper. Do you mind me asking what the the Ninja Trader DM indicator is?
DeleteI like the sound of taking trades with lots of momentum behind them and have been thinking much on what you said. I have been looking at I guess Breakout entries too as I assume a lot of early counter trend traders will have their stops just beyond these areas and so add more momentum to the move when they're taken out... I think you've mentioned this before either in a comment to me or in your blog?
What you mentioned about options was very interesting for me, I am a option ignoramius but do understand what the concept of what you say. You're most recent post on Trin cafe was also very enlightening!
Have a good Friday mate and thank you for the note on discipline. I struggle with that sometimes , it's good to have it hammered home!
Trend also depends on your chosen bar interval and time frame, which in turns reflects your personal choices regarding profit targets, stops, and trade duration. There are many trends on the 1 tick chart, fewer on the 15 second, fewer on the 1 minute, but still many. There are far fewer on the 5 minute and much fewer on the 15 minute. At that point, there is little point in trying to capture an intraday trend as you will be too late and your trend entry will at a point of S/R on the lower TFs and will receive an opposing force from those entering opposite your entry direction. Perhaps they will overcome the trend you have spotted, or perhaps they will only push the market so far as to make you believe your direction was wrong, possibly exiting an otherwise good trade. This can be seen as an exhaustive bar intra range on the 1 minute.
ReplyDeleteEither way, trend lines are certainly helpful, but the horizontal levels of previous S/R are what are determining the trend. [Well, traders are what are determining the trend, but the actions are most apparent at previous levels where either buyers or sellers were no longer willing to transact.] If a low end of a range holds with say a basic Low -> Retrace above Last Reaction High -> Higher Low -> Turn Up, the trend is now immediately up despite there having been a series of Lower Lows/Highs coming into this critical decision point. The next point of importance will be the opposite side of the range. A moving average is irrelevant and will assuredly be late it in its turn. However, it may be helpful as a mechanical guideline if necessary, although I would think it best to perhaps get rid of it altogether.
A trend line is closer in regards to accuracy as during the sequence describe above, the trend line will break. However, this of course depends on how the trader draws the trend line. In George's pictures, where he marks "TLB" (trend line break?) also marks the point of the last reaction low/high (or last swing low/high) being taken out. This is what is important, not the trend line. In the case of an up trending market when one arrives at the “TLB”, sellers have now shown the ability to overtake buyers OR buyers no longer cared to hold up the market, and the distance of the down wave has now exceeded the distance of the last wave up (therefore taking out the last swing low at the "TLB"). This alerts the trader to the potential change in the supply and demand characteristics of the market.
After the "TLB" marking, the market rallies only to find either excessive seller interest or lack of willing buyers to buy at prices higher than the last swing high (and actually failing to even make it there), and the market turns. This is a high probability entry into the "trend" although most traders (who lose by the way) would classify it as counter trend because their MA is still below the price, or the MACD hasn't crossed or whatever other nonsense one may have on their chart clouding their judgment says so. This says nothing about what will happen 1 or 2 minutes in the future, but at this point, the supply and demand characteristic of the market has shifted such that further down movement can be anticipated. However, the situation shown in the picture right below the one I'm referencing above could occur. But the trade aware of the possibilities will be prepared to react instead of waiting for indicators to do something.
Many of these ranges and corresponding "trends" are miniscule and such a sequence as described above will only be seen on a 1 tick or 5 second chart. Whether it is worth it to trade is up to the trader, but there is "trending" that exists at some level in all markets at all times. Anyway, this is how I look at things.
Hi JMF3, great to hear from you...
DeleteThank you very much for the comment and advice. What you said on TF is very interesting and I would like to ask your opinion. I don't have access to tick charts. I can only get as low as the M1 on MT4, is this something I should worry about or should the M5 and M1 suffice for the time being? TBH I'm not sure if i could interpret price much quicker at the moment. Also should I still use the M5 as my direction. I imagine if I get too caught up in the micro trend on smaller TFs I might get steam rollered later when the M5 re-establishes itself? Or do all trends on all TFs act the same way?
I have been adding in horizontal S&R although I still must say that I struggle to identify the correct ones, despite considerable help from you. I remember you mentioned once that probably the M30s S&R areas might be best for my M5 trading. However I can't always seem to get all of them without covering the chart? maybe I should quite moaning and get used to it? if there's any further tips I'd be most grafteful. Should i go for the most obvious, or the most recent? Sometimes I there's a couple or clear areas 9 pips from each other?
I agree that the EMA is irrelevant and try not to have it mapped too often, I certainly don't use it as a trend tool , just a potential entry, but I'm not particularly liking that either at the moment!
Thank you for clarifying the "trend Reversal"/ TLB ( Trend line break (correct)) . I had been thinking that once price makes a lower low in an uptrend that this marks the reversal of power to the bears. But had wondered if that was too simplistic? Al Brooks was a little confusing on the matter as he says that even after a TLB one should expect a test of the prior trend extreme before a reversal. Which I guess is also what you're saying but he was a bit noncommital on there being an actual reversal.
George - tick charts are unnecessary. The only point of the tick chart is as a learning tool - i.e. to train you to see the market as a continuous price discovery process instead of segmented into bar intervals. This is one of the reasons I have removed candles from my charts, to focus more on the vertical movement during any one bar interval and focus less (or not at all on the close and open of that bar interval). Long story short, 5 minute, 1 minute, they are all adequate, particularly if you become skilled at determining the trend and likely areas of support and resistance.
ReplyDeleteAs for horizontal lines - swing lows and highs are obviously the easiest levels to identify. These can alert you to immediate changes in trend as discussed above. However, lets think about what that point is - its a point where, in the case of a swing high, there was a complete lack of any willing buyers to purchase from those selling. Thus, sellers had to lower their price in order to find more buyers. These are low volume points (the final high could be only a single transaction), but important as they represent the area where one party, either buyers or sellers were no longer willing to transact (or consumed by the transactions of the other side - both thought processes lead to the same outcome - no more buyers were able to buy at that level).
High volume areas, however, will also represent S/R. I will try to mark some of the HTF charts I watch to give you an idea of what I mean, but often price trends hard (looking for value), and then ranges (finding value, or agreement between buyer's and sellers). The range will then be tested on both sides, perhaps once, perhaps many times. The midpoint and the extremes of these ranges are also possible areas of S/R. However, its often best to wait for the range to break and then trade the retracement.
More charts to follow...time to trade.